
Frontend
Static Astro site with React islands: company-wide KPIs, provider comparison, history charts and one page per provider, broken down by model and token type. German and English.
- Astro 7
- React 18
- Recharts
- TypeScript
- nginx
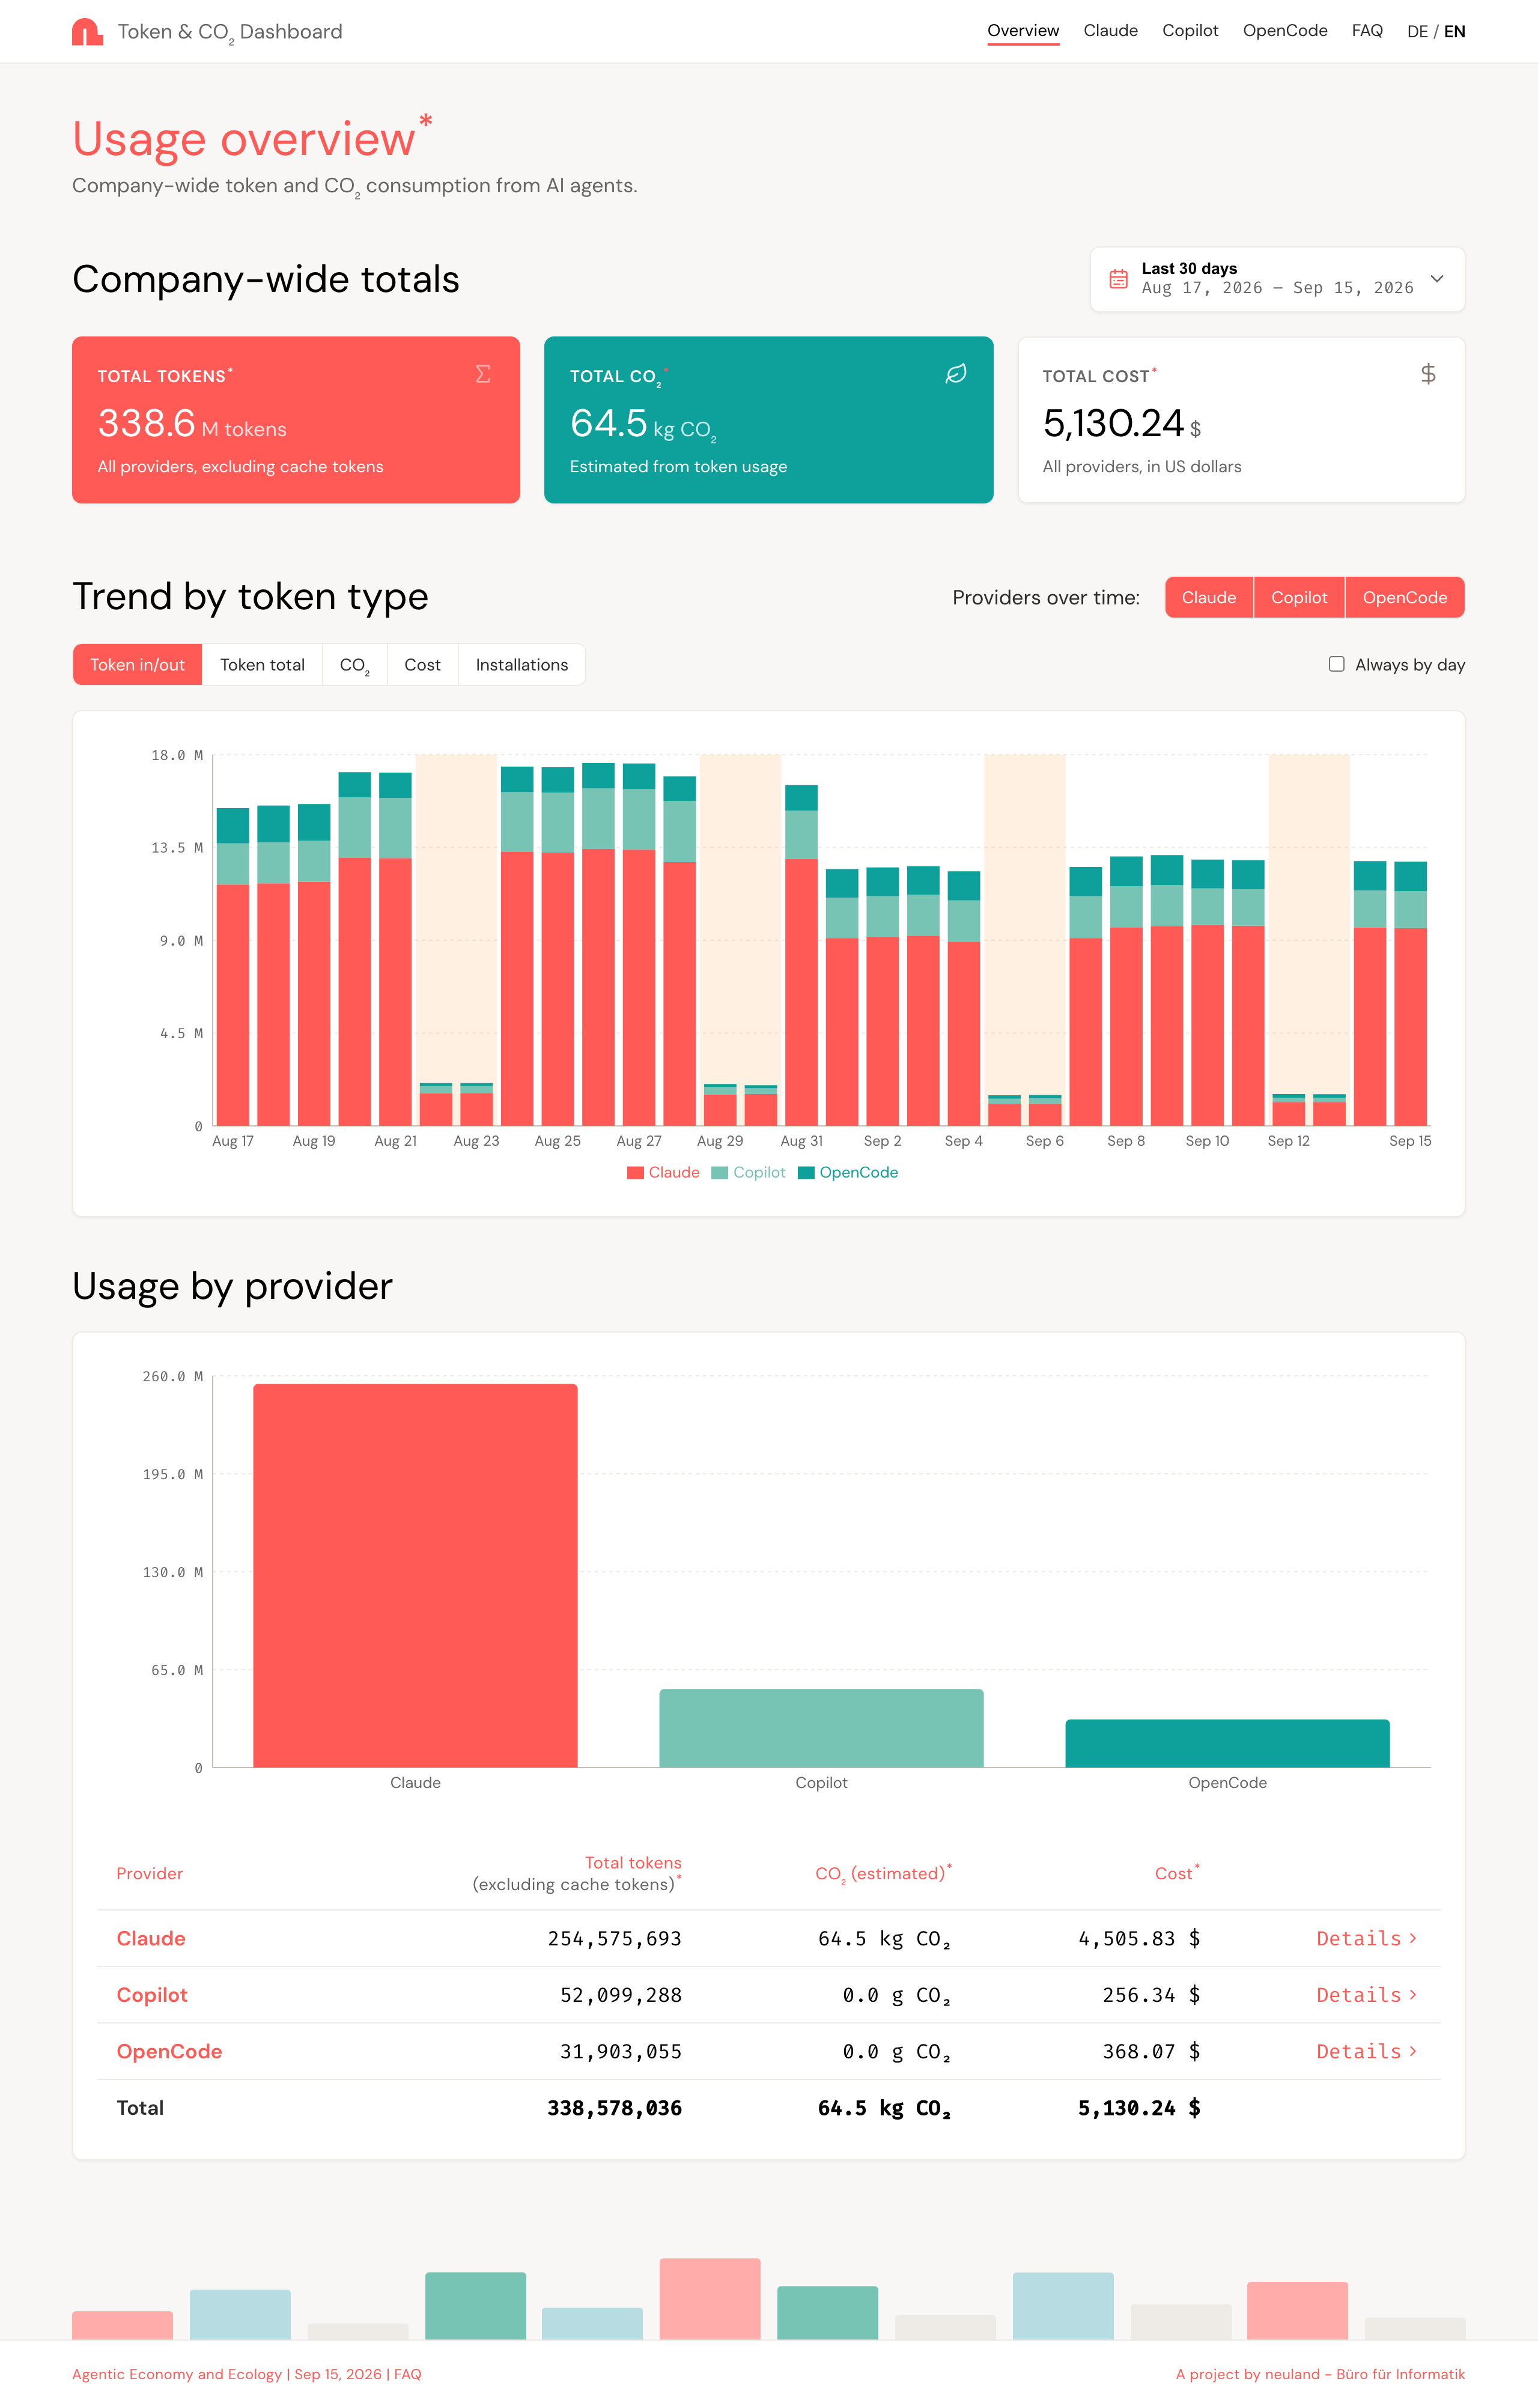
Tokens, cost and an estimate of CO₂ — company-wide, across Claude Code, GitHub Copilot and OpenCode. Open source, self-hosted, and unable to attribute usage to a person.
Coding agents run all day. The tools themselves don't say what that costs.
Seat-based plans expose no usage API. The counts exist only inside each developer's CLI.
Both derive from the same raw token counts — so one system should produce both.
The dashboard counts installations and aggregates usage. It cannot attribute a token to a person or a team.
Plugins push, the backend prices, the frontend shows. Nothing polls a provider.
tokendashboard-plugin-claude hooks read the transcript per turn tokendashboard-plugin-copilot waits for session.shutdown tokendashboard-plugin-opencode one entry per assistant message POST /api/usage/ingest/{provider} postgres usage · prices · co2_factors · installations (uuid only) GET /api/usage/*/v1 also: GET /api/prices/claude → statusline prices Only token counts, a session id and a random installation UUID leave the machine. No prompts, no usernames.
A plugin hooks into the CLI's lifecycle and reads the token usage the tool already knows: input, output, cache write, cache read — per model.
Entries go to a local queue first and are sent in batches when the backend is reachable. Off-VPN, nothing is lost and nothing blocks.
The backend deduplicates, applies per-model prices and CO₂ factors, and stores counts, cost and CO₂ in Postgres.
The static frontend renders totals, comparisons and time series for any date range — in German or English.
Sent: token counts, session id, timestamp, a random installation UUID. Never sent: prompt content, usernames, hostnames.
Five repositories. They meet at the backend's ingest and query endpoints.
Static Astro site with React islands: company-wide KPIs, provider comparison, history charts and one page per provider, broken down by model and token type. German and English.
Kotlin/Ktor service with Postgres. Plugins push raw token counts; the backend deduplicates, applies prices and CO₂ factors and serves aggregates and time series. It never polls a provider.
Registers hooks in Claude Code, reads the transcript after every turn and queues one entry per model — subagents included. Ships a statusline with session tokens, sync state and price.
Copilot CLI only exposes totals in its session.shutdown event, so the plugin captures per session in a detached process that outlives Copilot, and sweeps for missed sessions on the next start.
A single dependency-free file loaded in-process by OpenCode. Subscribes to message.updated and session.idle and queues one entry per finalized assistant message.
A plugin is anything that POSTs this shape. Ingest routes are unversioned and additive-only, so a plugin written today keeps working. New providers also need a price table and, ideally, a CO₂ factor on the backend side.
POST /api/usage/ingest/<provider>
{
  "user_id": "<random uuid, generated once per installation>",
  "prompts": [{
    "timestamp":  "2026-09-15T10:00:00.000Z",
    "session_id": "…",
    "model":      "claude-sonnet-5",
    "usage": { "input_tokens": 1234, "output_tokens": 567,
               "cache_creation_input_tokens": 0, "cache_read_input_tokens": 890 }
  }]
}A company-wide overview and one page per provider. Screenshots show demo data.

Tokens, estimated CO₂ and estimated cost for the selected period. Total tokens counts input and output only — cache tokens are shown separately so they don't drown the trend.
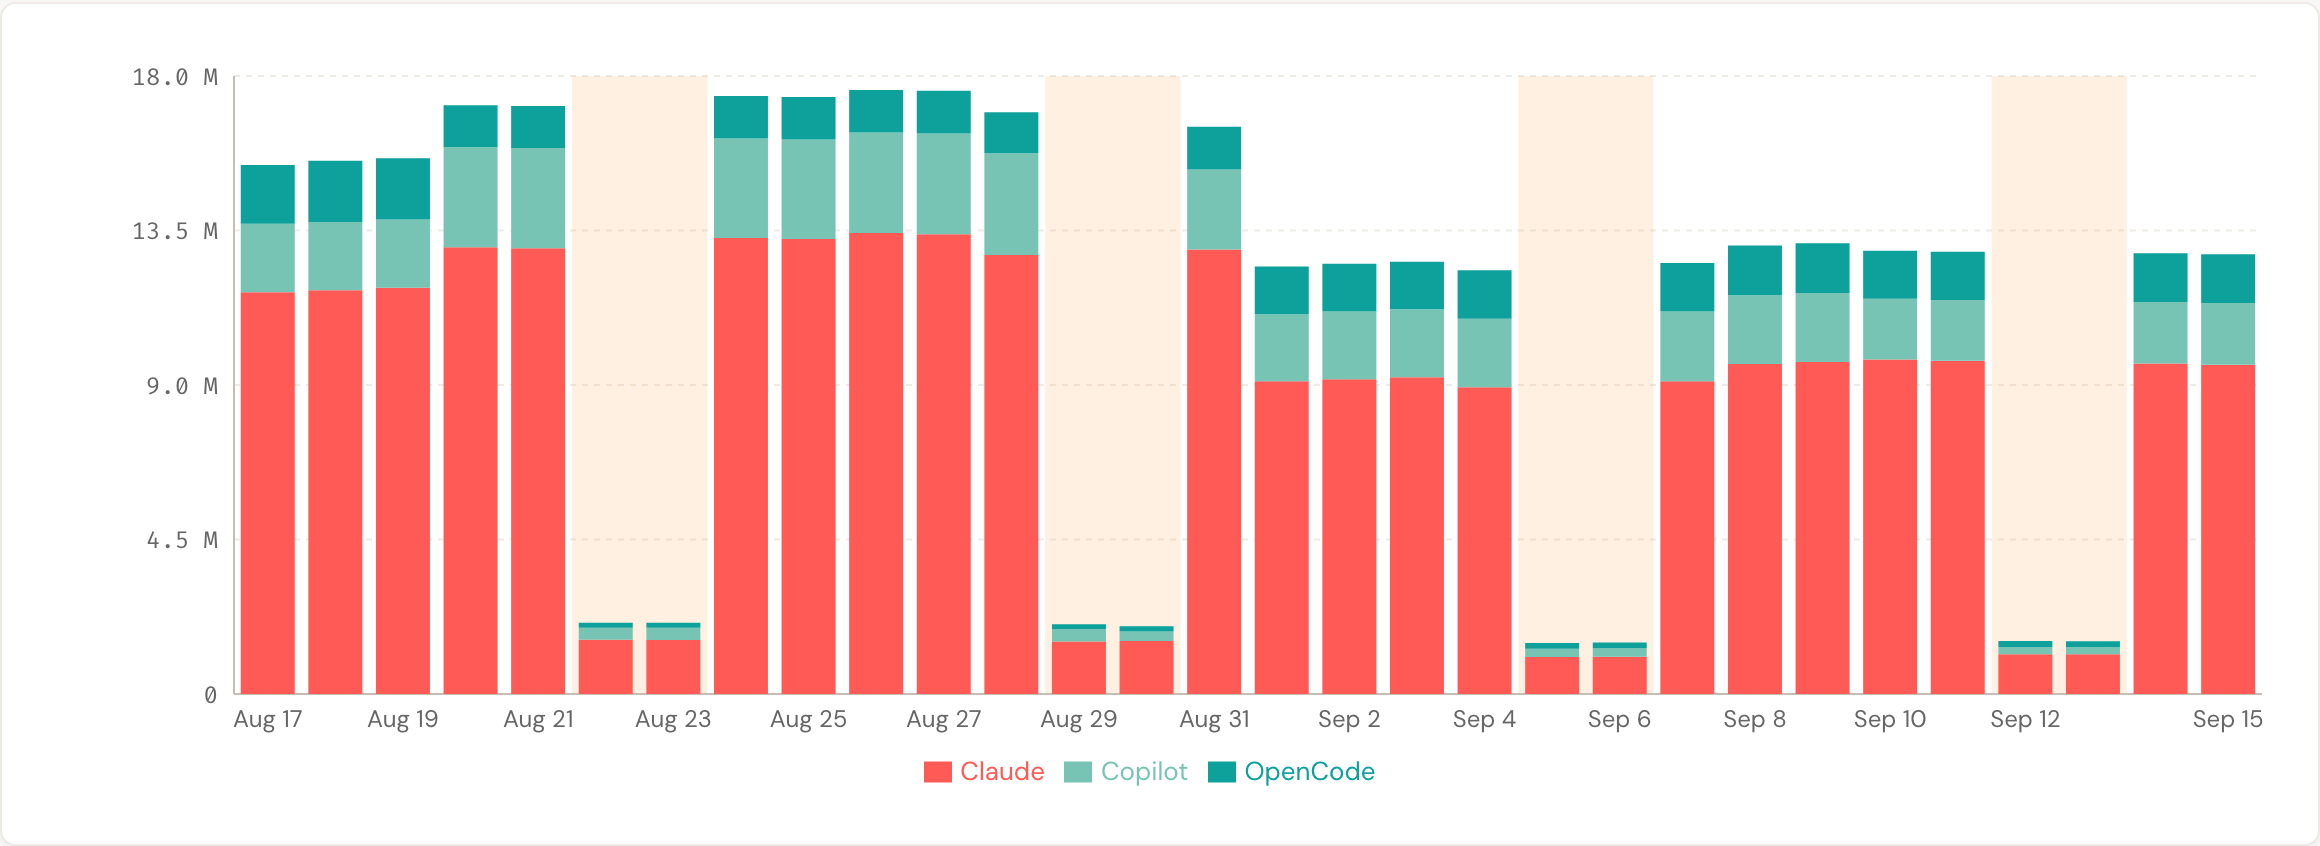
One stacked bar per day or week, one segment per provider. Switch the view to CO₂, cost or active installations; toggle providers; weekends are shaded.
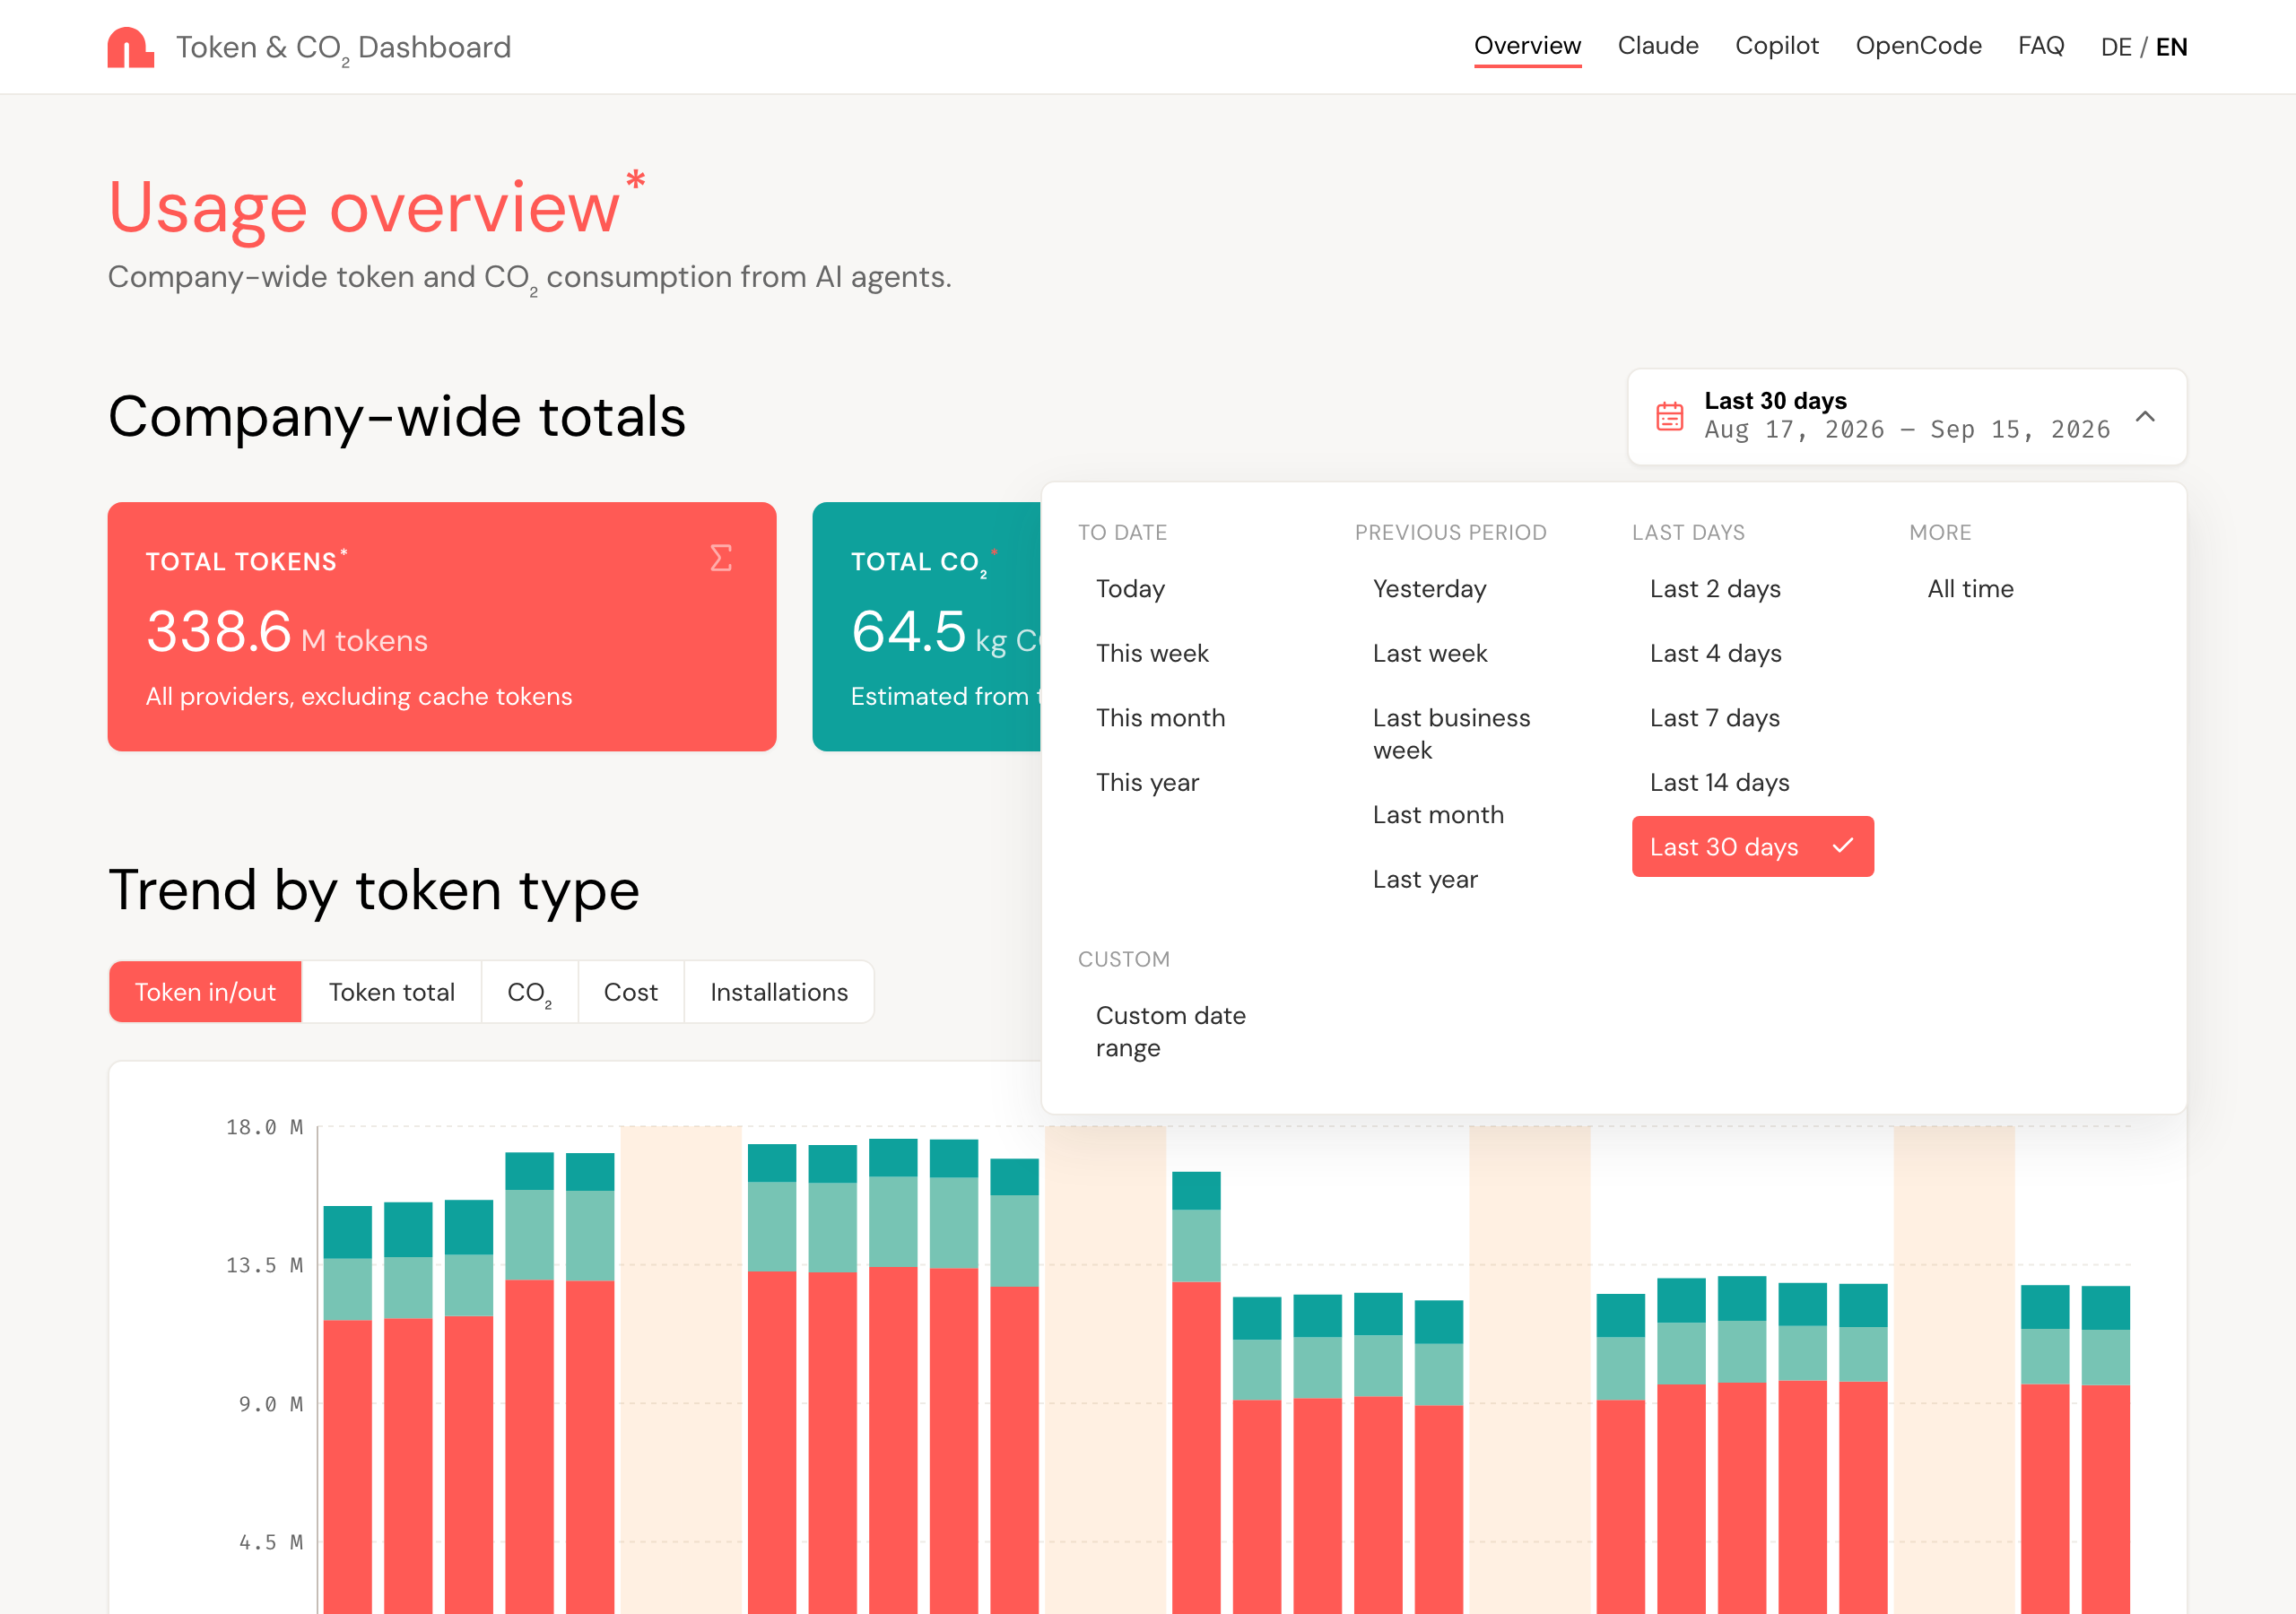
Presets like "this month" or "last 30 days" live in the URL, so a bookmarked "this week" still means this week next Monday.

Each provider page shows how many plugin installations reported in the last four weeks, and the install command with the operator's URLs filled in. Installations are counted, never people.
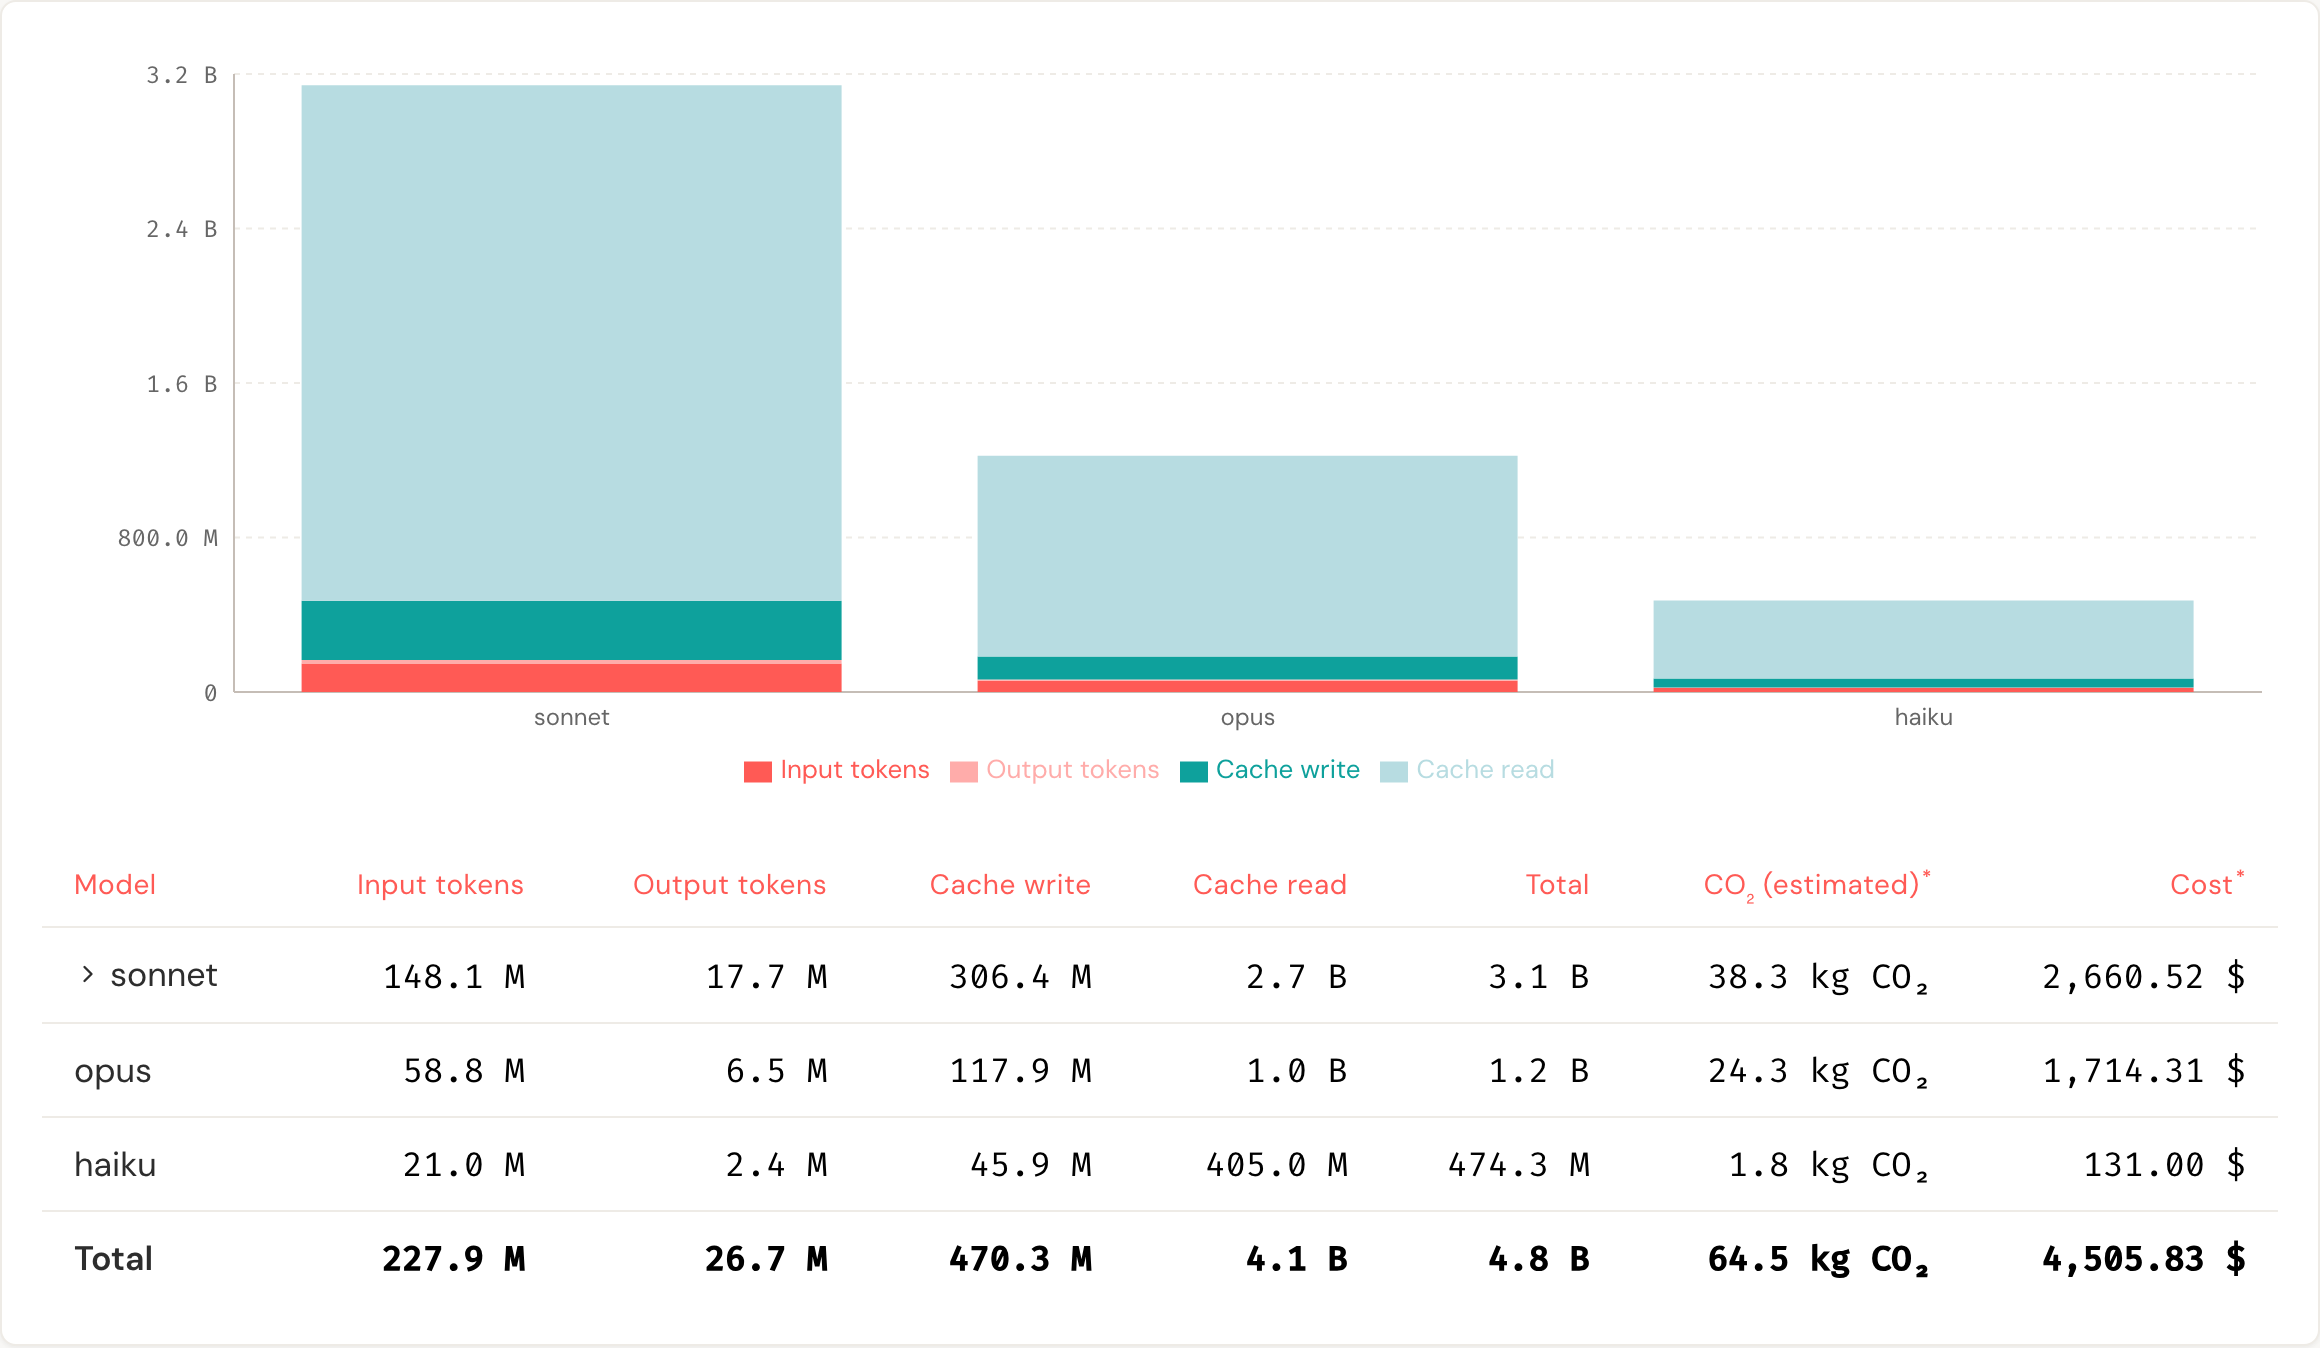
Input, output, cache write and cache read per model family — where cache reads become visible in their true proportion.
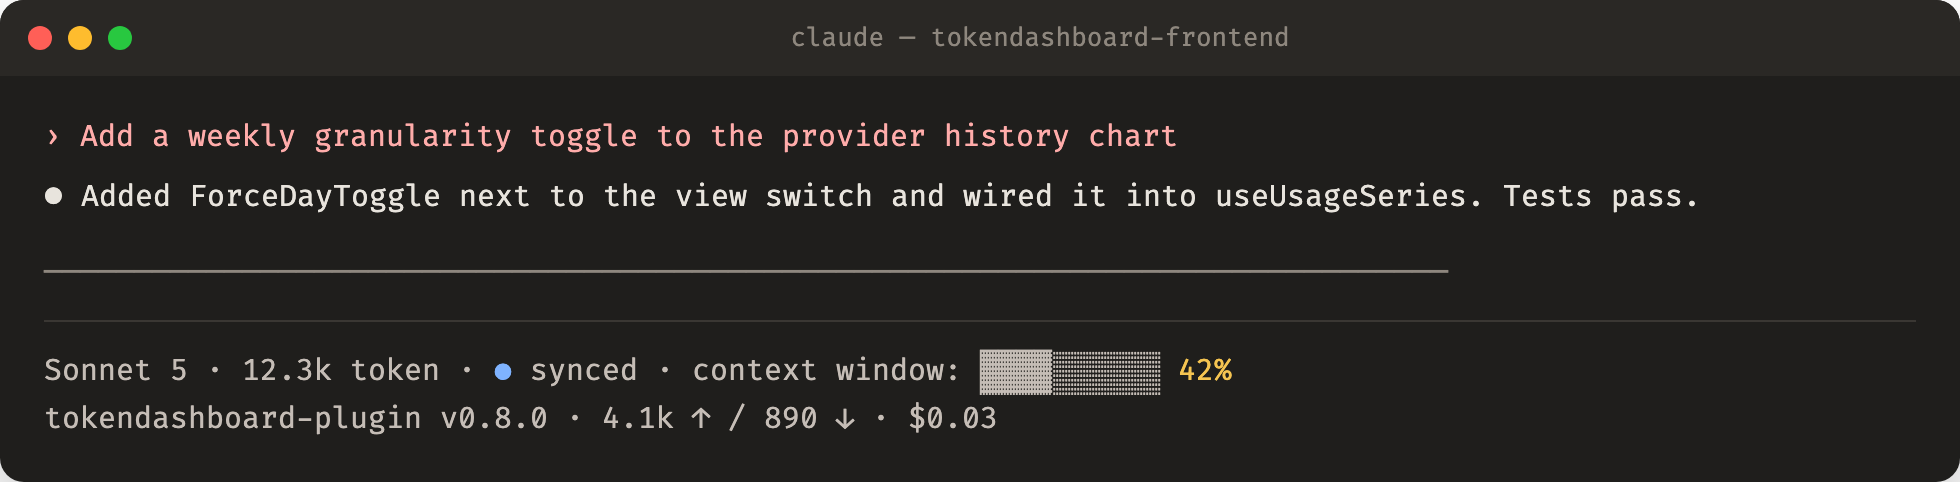
The plugins install a statusline: model, session tokens, sync state, context window and an estimated price. Illustrative rendering of the real output.
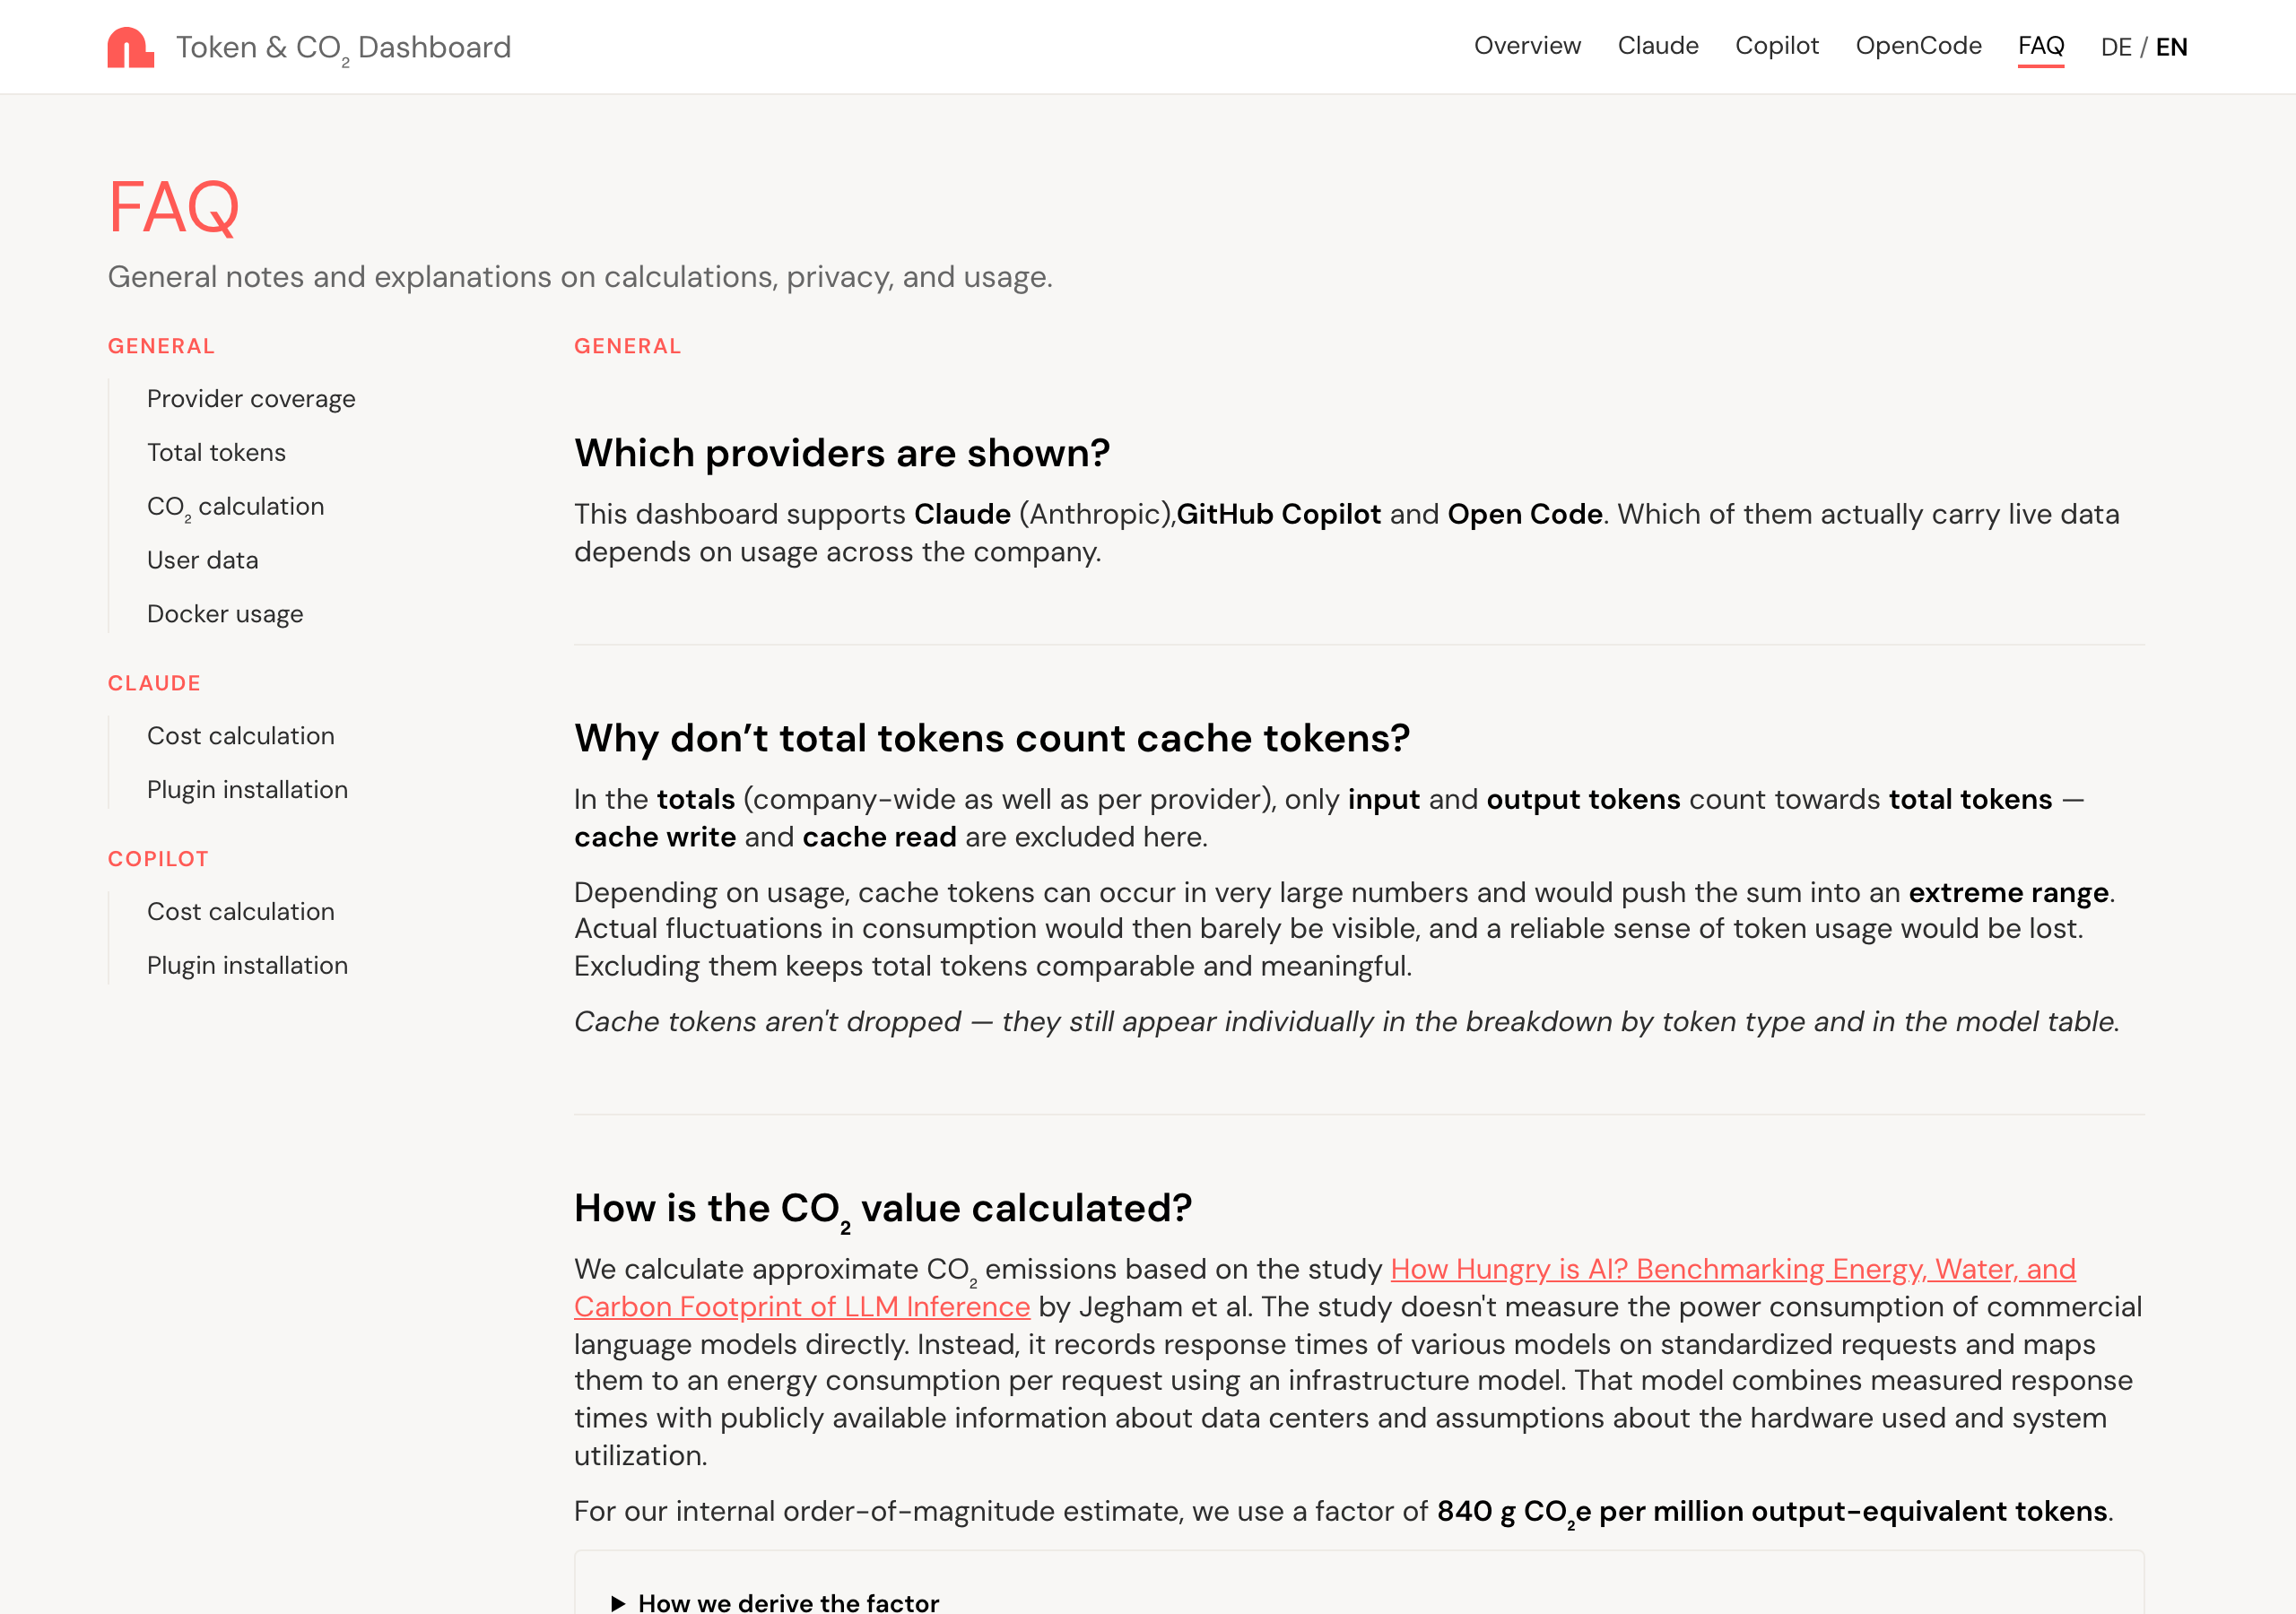
Every estimate carries an asterisk that links here: how CO₂ is derived, how costs are computed, what data exists about installations.
The numbers, and what stands behind them. Details live in the repositories.
Input, output, cache write, cache read. All four are stored; only input and output form the headline total, because cache reads outnumber everything else by an order of magnitude.
A price table per model and token type, applied at ingest. Estimates for trend visibility, not billing. Copilot is approximated at one cent per AI unit.
Derived from Jegham et al. for Claude 3.7 Sonnet; input weighted at 1/20 of output, cache reads at 1 %. An order-of-magnitude estimate, not GHG accounting. Derivation
Usage data carries no identifier at all. The only UUID is random, per installation, never derived from a name, and used solely to count active installations. No prompt content, no authentication, VPN only. Security model
Plugins queue locally and flush in batches at session boundaries. Transient errors retry; entries expire after 30 days. Plugin ADRs
Once a day each plugin fetches its updater from a URL the operator chose at install time. HTTPS only, no redirects. Decision log
How the numbers are calculated, what is left out, what is stored — and why.
Free write tokens (e.g. OpenAI cache writes) are counted in the dashboard even though they don't directly contribute to cost
Read why → PrivacyNo authentication; reachable only via VPN. Sender of usage data cannot be traced on the data level. Prompt content is never collected or sent to the backend — only token counts.
Read why → ArchitectureClaude is the strongest-usage provider, and its subscription plan doesn't expose tokens via API — only pay-as-you-go plans do, which isn't our setup. A plugin architecture handles this and other …
Read why →Someone operates the backend and frontend. Every developer installs a plugin.
PUBLIC_* variables; serve it and route /api to the backend on the same origin.Copy the command from your dashboard's provider page, or adapt one of these. Both flags are required.
npx git+https://github.com/neuland/tokendashboard-plugin-claude.git install \
  --api-base-url https://tokendashboard.example.com \
--repo-raw-base-url https://raw.githubusercontent.com/neuland/tokendashboard-plugin-claude/mainnpx git+https://github.com/neuland/tokendashboard-plugin-copilot.git install \
--api-base-url https://tokendashboard.example.com \
--repo-raw-base-url https://raw.githubusercontent.com/neuland/tokendashboard-plugin-copilot/mainnpx --allow-git=all git+https://github.com/neuland/tokendashboard-plugin-opencode.git install \
--api-base-url https://tokendashboard.example.com \
--repo-raw-base-url https://raw.githubusercontent.com/neuland/tokendashboard-plugin-opencode/mainBugs and features go to the repository they concern.
tokendashboard-frontend The dashboard people open in the browser. tokendashboard-backend Receives usage, prices it, estimates CO₂, aggregates. tokendashboard-plugin-claude Hooks into Claude Code, reads the transcript, reports per turn. tokendashboard-plugin-copilot Waits for Copilot’s session.shutdown event, reports per session. tokendashboard-plugin-opencode Loaded in-process by OpenCode, reports per assistant message.